Receiver Performance
RECEIVER/TRANSMITTER ENGINEERING ANALYSIS |
Comments |
 |
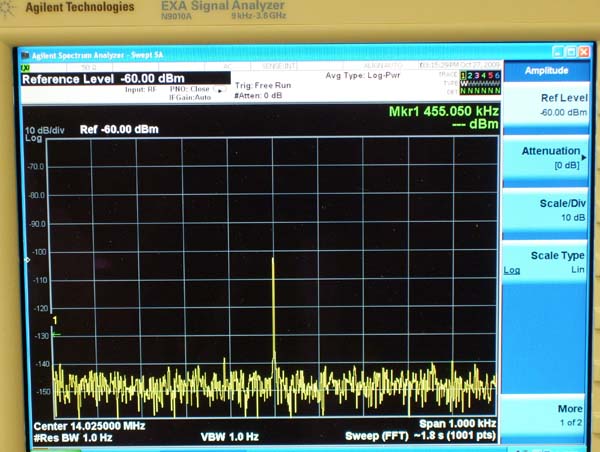
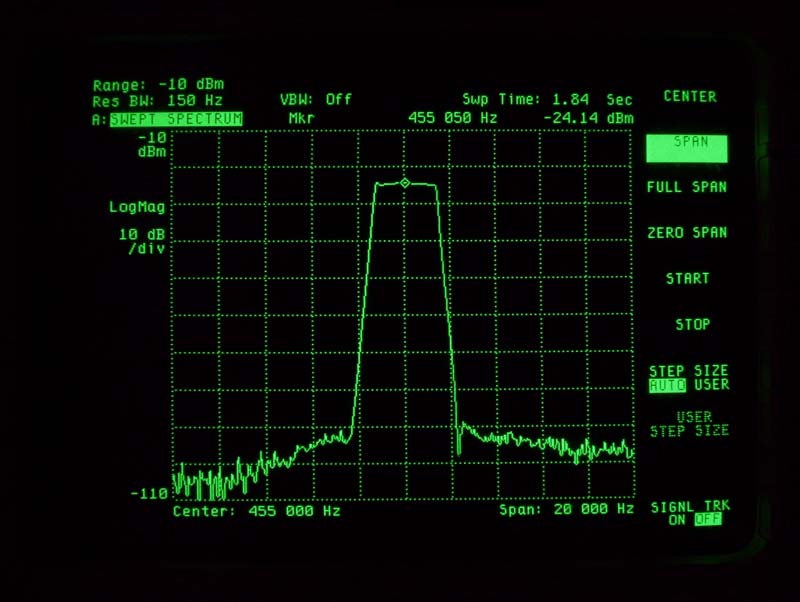
Here is the input to the receiver board after passing through the antenna switch, SWR meter, transmitter low pass filters, T/R circuitry, receiver bandpass filters and preamps. Preamps were off. Frequency was 14.025MHz with -100dBm going into the antenna jack.
(Signal generator was an HP8924e set to -60dBm, then going through an HP 355D step attenuator set to 40dB. Actual -100dBm signal was verified on the N9010A.) Note that even with a high resolution, low noise spectrum analyzer like the N9010A, it is impossible to see the actual noise floor. It is at least -148dBm and probably much less. No spurs are visible within +/-500Hz. So the visible 30dB of S/N is not really 30dB but something greater. Loss up to the bandpass filters is about 3dB, so there's about 10dB of loss in the filters. |
 |
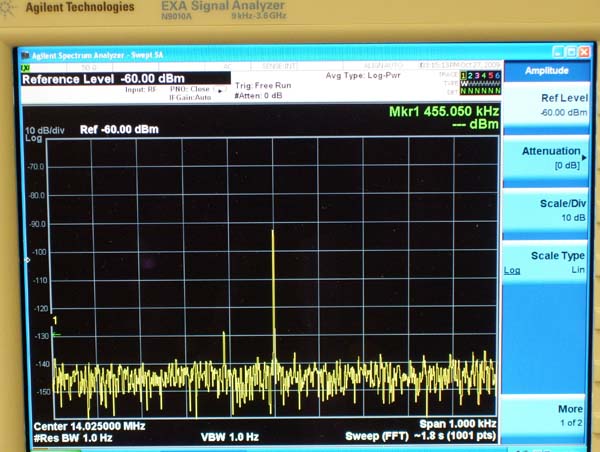
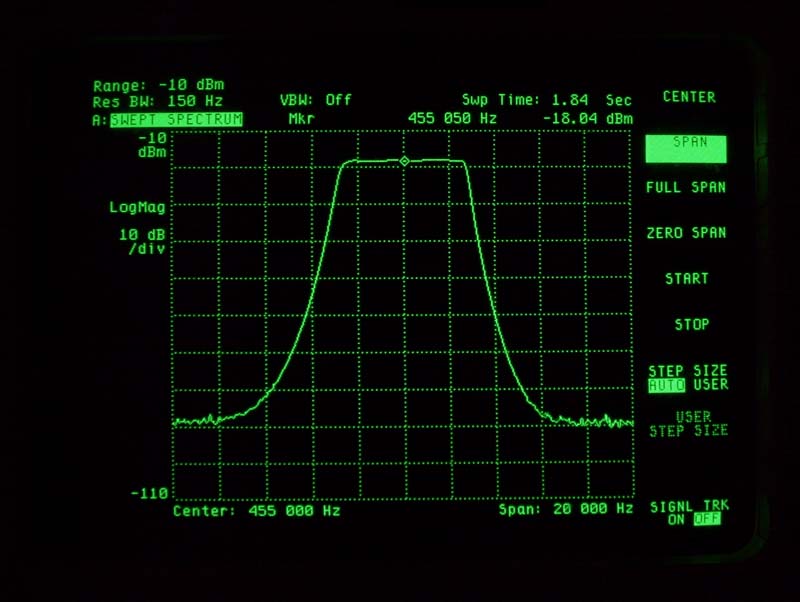
Here's the same setup as in the photo above with one preamp on. The first preamp adds a little over 10dB of gain, but you can also see a small spur about 110 Hz away. The actual noise floor is still below the visible noise floor of the spectrum analyzer (-148dBm). The S/N is thus greater than 45dB. |
 |
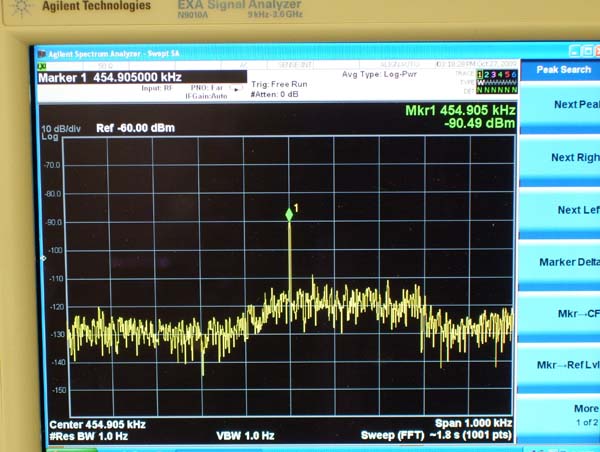
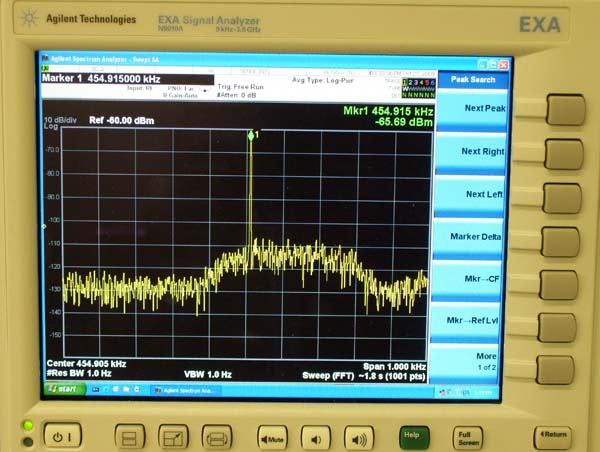
Same setup as previous photos, but with two preamps on. The second preamp also shows the small spur, slightly larger now. But notice that with an input signal of -100dBm, there's about 50dB of signal to noise. We can finally see the noise floor of -145dBm, which is elevated due to the noise added by the preamps. This picture implies that a sensitivity of at least |
 |
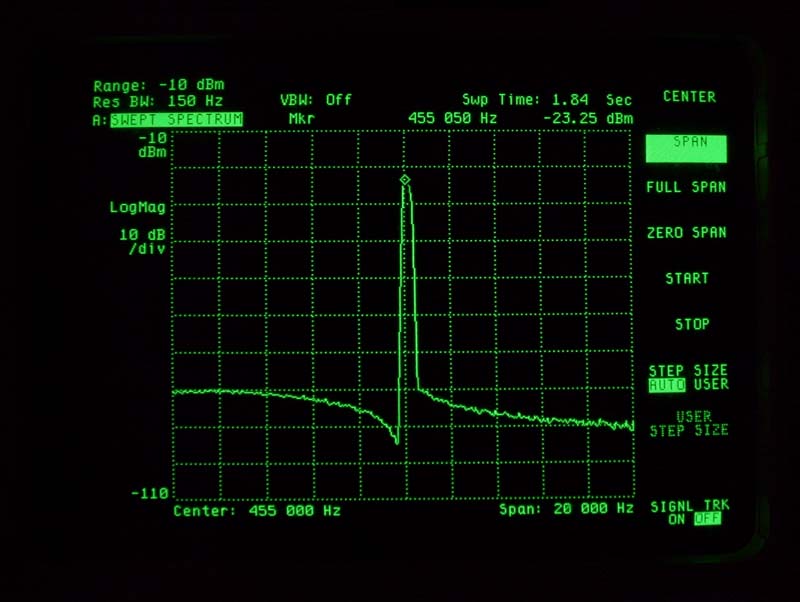
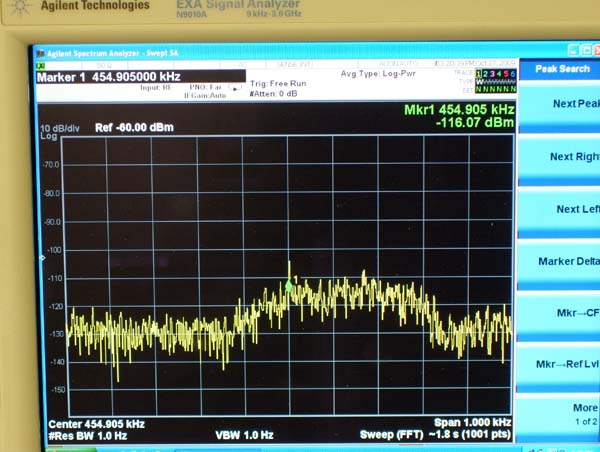
After traversing the 70.455MHz 4.5kHz 6-pole roofing filter, the 9.0007MHz 400Hz 8-pole 2nd IF filter, and the 455kHz 400Hz 8-pole 3rd IF filter, not to mention amplifiers, mixers, noise blanker, and more, here's a -100dBm antenna input as it appears at the input to the product detector, with preamps off. The 25dB of clean signal to noise implies that a -115 to -120dBm sensitivity is possible with both preamps off. The only stages following this point are the detector (an SA612 Gilbert cell mixer) and a couple of audio amps, with 2 poles of rolloff with a breakpoint at 2.5kHz. Note: The spectrum analyzer's noise floor is -130dBm at this resolution and frequency, so it is impossible to tell how far below the -130dBm line the bottom of the filter lies. The measured performance of the crystal filters shows at least 57dB with the 400Hz filters (in use for this photo) and as much as 75dB from top to bottom for the SSB filters (see next three pictures). So we can infer that the noise floor may be around -140dBm at this point. |
 |
Here's a shot of the 400Hz BW Inrad 455kHz filter performance in-circuit. Simple diode switching, careful impedance matching and coaxial cable signal transfer accomplished this. Similar results were obtained with the other available filters. See next two pictures. |
 |
Here is the 2.8kHz BW Inrad 455kHz filter in-circuit in the Sienna. |
 |
Here is the 5.8kHz BW Collins mechanical 455kHz filter in-circuit in the Sienna. |
 |
Here's a -100dBm signal at the antenna as it appears at the input to the product detector with both preamps on. There's about 45dB of signal to noise with -100dBm at the antenna, which should translate to well over -130dBm MDS. If you look at the 3rd picture above, you can see that we lost only about 3dB of S/N going through the receiver. We started with 48dB and now have 45dB. Again, the spectrum analyzer's noise floor is -130dBm at this resolution and frequency, so it is impossible to tell how far below the -130dBm line the bottom of the filter lies. When this signal is detected (converted to audio) and amplified, there will still be about 40dB of signal above the low frequency noise and at least 60dB of signal above the higher frequency noise. This is one of the things that contributes to Sienna's great sounding audio. |
 |
Here's a -140dBm signal, preamps on, at the input to the product detector. You can see about 10-15dB of signal to noise. It is not usually possible to get a signal with this low of a S/N ratio through the product detector and then out to audio and still be able to hear it. Another 10dB of S/N would be useful. But we're working on it! |
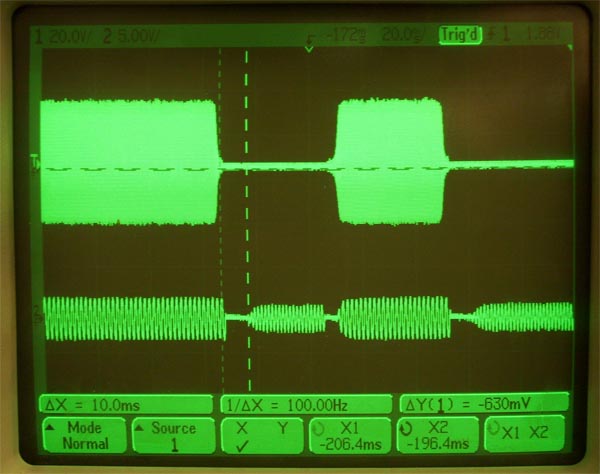 |
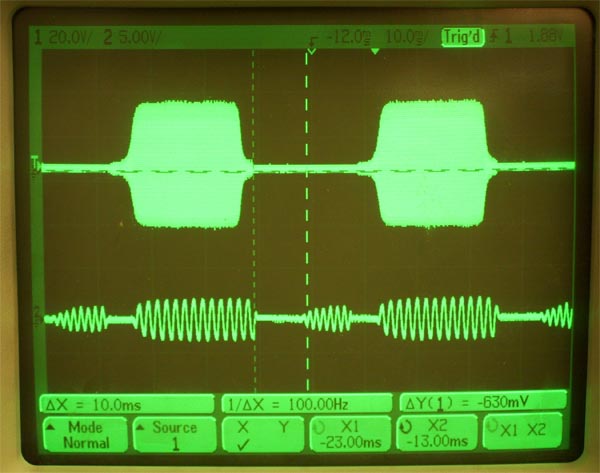
Here's a shot of the RF output vs. the speaker audio, showing QSK (Full break-in) performance at 30 wpm (40ms per dit). During transmission, you can see the sidetone. During reception (the gap between the RF pulses) you can see a signal being received on the main antenna. As you can see from the location of the cursors, the T/R latency is 10 ms. When operating at 60 wpm, where the dit time is only 20 ms, that leaves 10 ms to hear any signals, but you can indeed hear them because the switching is so quiet. See the video below. |
|
Here's a video of Sienna transmitting 5 Watts at 60wpm, with the receiver connected to the main antenna. The internal CW buffer was used to send "CQ CQ CQ" several times. The solid-state T/R switch switches cleanly with no glitches, and you can see and hear a signal coming through. The signal was turned on and off several times so that you can hear the difference between normal background and one with a signal present. The upper trace is the RF output, taken at the antenna jack. The lower trace is the audio output, taken at one of the loudspeakers. Note the "clickless" audio - sidetone as well as received signal. |
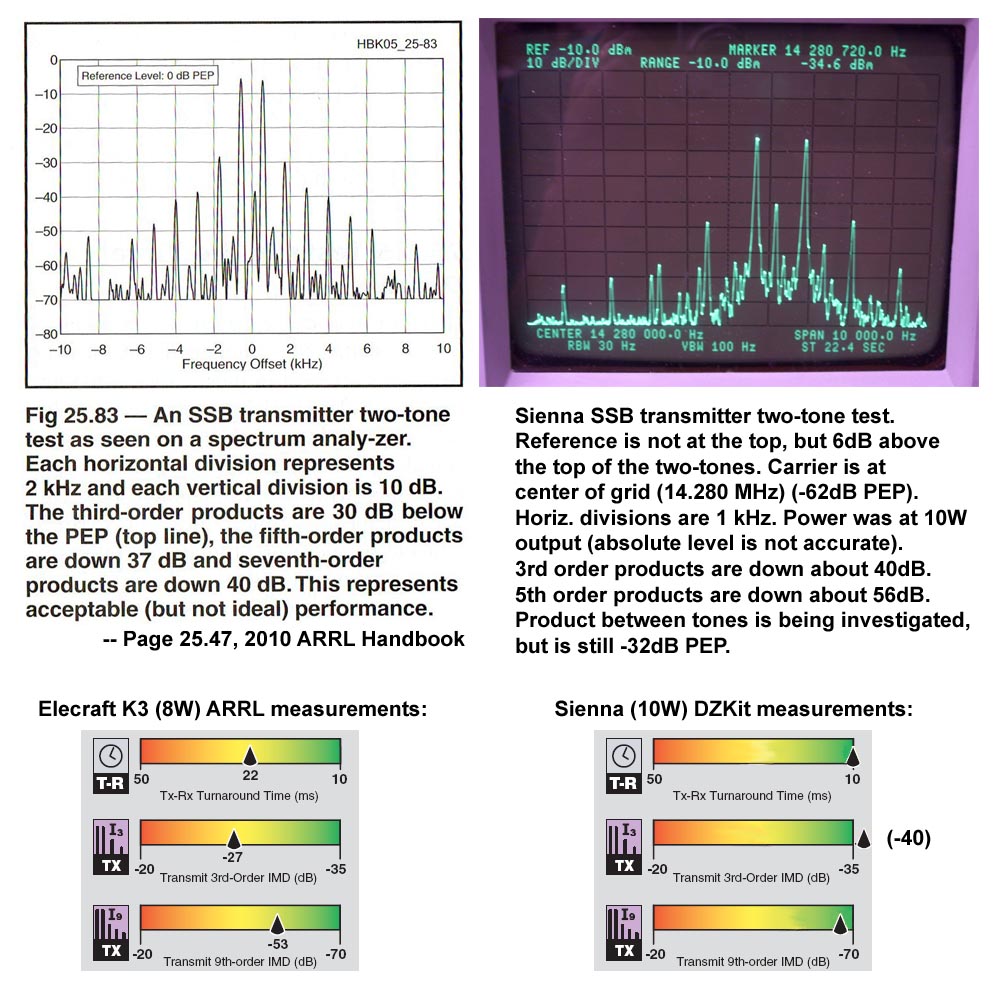 |
Tx 2-tone intermod tests.
Absolute value of scale is not accurate. Transmitter was set for 10W PEP, measured on a wattmeter and oscilloscope (67Vpp). Frequency was 14.280 MHz, USB. Carrier is -62dB PEP 3rd order products are -40dB PEP 5th order products are -56dB PEP 7th order products are -61dB PEP 9th order products are -64dB PEP ARRL testing of the Elecraft K3 at 8W, from the 2008 test report published in QST is shown for comparison. |